Visualizer provides formatting options for measure data displayed in axis, tooltip, and display values. You can format the following:
- Unit symbols that represent magnitude, such as M for millions;
- Suffix symbol for percentages (%);
- Decimal precision display;
- Currency symbols.
You can format currency symbols and decimal places for any measures, including the following:
- Measure expressions created in Visualizer;
- Custom measures created in the Admin module.
Note:
- Currency and date formatting also depends on the user's language locale setting.
- A measure's Data Formatting applies across the visual elements that use the measure.
Tip: You can override the data formatting at
the chart formatting level for axis, tooltip, and display values. For
example, you can set the Y-axis unit on a chart to be different than the
tooltip unit.
Format the Measure Values in a Chart
- Click a measure in Chart Builder. The options menu opens with a section for
each measure.
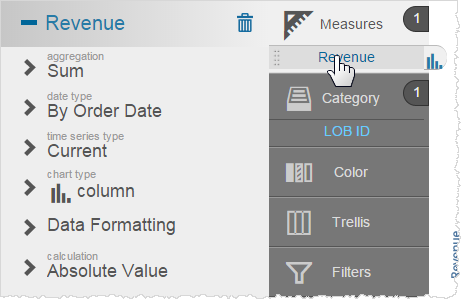
- Click Data Formatting for the column you want to change. Visualizer displays the
options with the defaults selected.
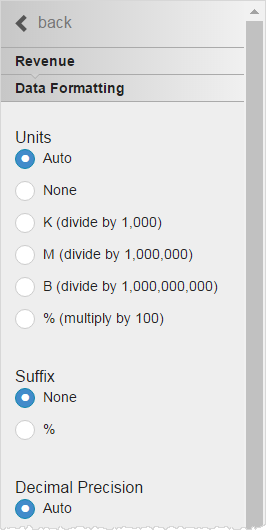
- Select the
unit you want to use for formatting numbers from the following options:
- Auto (default)—commas (150,413,715)
- None—no commas (150413715)
- K—divide by 1,000 (150,413.71K)
- M—divide by 1,000,000 (150.41M)
- B—divide by 1,000,000,000 (0.15B)
- %—multiply by 100 (15,041,371,500%)
Note: When you select an option, Visualizer immediately updates the chart axis and tooltips. - Select the suffix, for display purposes only.
- Select the decimal precision.
- Select the
currency symbol. This is for display only; it does not change the data.
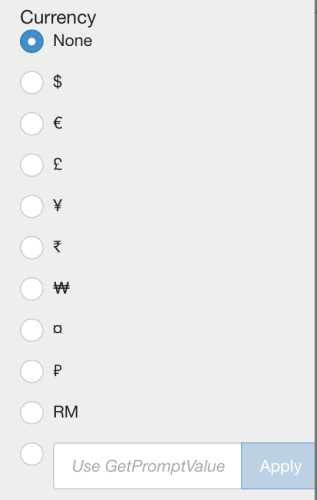 Note:
Note:- Visualizer supports dynamic currency symbols. You can define a variable and use it as the currency format by entering the GetVariable('variable_name') syntax.
- If you have merged more than one measure on an axis, and the currency symbol is not the same for each measure,
Visualizer does not display a currency symbol on the axis. To display
a currency symbol on a merged axis, set both measures to use the same
currency.
- Click Save.
Tip: You can override formatting at the data level with formatting at the chart level.


